
by Dirk Van Damme
Head of the Innovation and Measuring Progress division, Directorate for Education and Skills
Teachers are often accused of conservatism and resistance to change. Many education policy makers can list numerous examples of well-intentioned reforms that were opposed by the teaching profession and their union representatives in the past. But teachers will argue that reforms are often imposed from the top down, without much consultation with or respect for the professional wisdom and experience of the teachers themselves. At the same time, the teaching profession has not yet completely succeeded in developing a dynamic and change-oriented perspective for its future. The result is that teaching methods and techniques that have worked in the past have become the yardstick by which to assess – and often condemn – ideas about what could work in the future. At least, this seems to be the dominant view.
The finding that, in fact, teachers become more satisfied in their work when education systems go through a process of innovation may thus come as a complete surprise. Innovation and teacher job satisfaction are not mutually exclusive. A new publication from the OECD Centre for Educational Research and Innovation (CERI), Measuring Innovation in Education: A New Perspective, brings together a wealth of data from the Trends in International Mathematics and Science Study (TIMSS), the Progress in International Reading Literacy Study (PIRLS) and the OECD Programme for International Student Assessment (PISA) that capture various forms of innovation in education. It also presents a composite innovation index for 28 countries or school systems with sufficient amounts of data for the period 2000-11 that covers several areas of innovation-oriented change, such as innovation in instructional practices, in class organisation, in methods of assessment, in the use of technology, in teacher evaluation and feedback mechanisms, and in the ways schools interact with their environments. The composite index measures the size of the changes that have occurred over time as a result of the combined effects of these innovations. (Of course, these school systems might have very different relative positions on the respective indicators.)
According to this index of overall innovation, Denmark, Hungary, Indonesia, Korea, the Netherlands and the Russian Federation have seen the greatest innovation-orientated change between 2000 and 2011. The state of Massachusetts in the United States, Austria and the Czech Republic show the smallest innovation-oriented change. The greater change seen in countries like Indonesia and the Russian Federation can be explained by a catch-up effect, whereas the relatively small change seen in Massachusetts may reflect the state’s already-high level of innovation in education at the beginning of the period. Both the Russian Federation and Indonesia show large changes in more interactive and realistic instructional practices, in encouraging students to reason, rather than learn by rote, in independent work by students, in giving more individual attention to students, and in changes in class organisation and assessment. Both countries also reported large improvements in the use of information and communications technology and in Internet connectivity in the classroom. In Massachusetts, these practices were already in place in 2000 or a negative change was observed in some of the data.
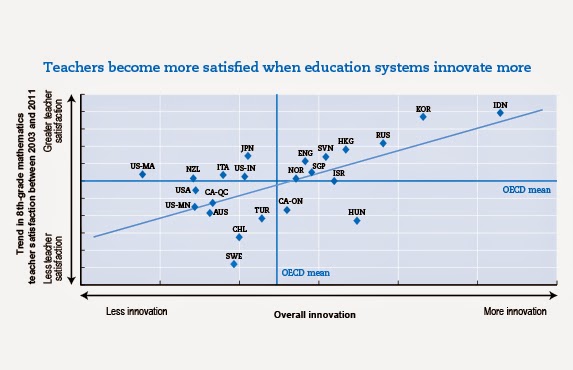
In 23 school systems, this overall innovation index can be correlated with a measure of satisfaction among 8th-grade mathematics teachers between 2003 and 2011, based on TIMSS data (see chart above). The outcomes of this exercise are amazing: the correlation between the two sets of data is strong. In general, school systems that have gone through an intense process of innovation in education tend to be those where teacher satisfaction has increased the most. The relationship is very clear in the upper right quadrant, which includes countries that have innovated more than the average among the OECD countries with available data. However, less change related to innovation does not necessarily correlate with less teacher satisfaction. Some countries in the lower left quadrant have seen a smaller increase in teacher satisfaction than the OECD average, or, in the case of Chile and Sweden, even a decrease, but in the other countries shown on the left of the chart, there is no real relationship between the two data sets.
The composite system-level innovation index includes measures of innovation-oriented change on two levels, the school level and the classroom level. The analysis shows that classroom-level innovation is more strongly correlated with the trend in teacher satisfaction. Clearly, innovation that affects teachers’ daily work – and which probably tends to increase their professional autonomy – matters most for teacher satisfaction.
Interestingly, the composite system-level innovation index also correlates positively with trends in the TIMSS 8th-grade mathematics learning outcomes between 2003 and 2011, as well as various PISA measures of equity in learning. At the risk of over-generalising, it seems that the kinds of innovation in education captured by this OECD innovation index increased the capacity of teachers and schools to cope with challenges, boosted teacher autonomy, and improved teacher satisfaction, ultimately improving students’ learning outcomes and the capacity of systems to create favourable learning conditions for all students in a more equitable manner.
The bottom line is that change, in itself, does not run counter to teacher satisfaction – quite the contrary. In countries or systems where there was a process of rapid innovation-related change, teachers reported greater job satisfaction. If teachers react so positively to change, they can hardly be seen as “conservative”.
Links
The Centre for Educational Research and Innovation (CERI)
OECD Programme for International Student Assessment (PISA)
Chart source: © OECD