
by Dirk Van Damme
Head of the Innovation and Measuring Progress Division, Directorate for Education and Skills
The international statistical system, one of the great achievements of international organisations, has mirrored the evolution of the nation-state. International statistics – and those related to education are no exception – were tuned towards comparing and benchmarking countries against each other. National averages thus became the dominant data. Most of the data points in Education at a Glance, for example, are national averages. However, the expansion and increased sophistication of data collection and data processing have allowed for the development of many more measures than just national averages. Indeed, averages without more detailed measures of how indicators are distributed across various subpopulations offer little added value when it comes to understanding the real world.
Through its “New Approaches to Economic Challenges” initiative, the OECD is working to highlight distributional measures in its statistical apparatus. In Education at a Glance, for example, our analyses increasingly focus on the distribution of education indicators by gender, age, socio-economic status and immigrant background around the national average.
So far, little effort has gone into exploring regional variations within countries. Technical shortfalls, such as the lack of regional data in existing data collections, but also political sensitivities, have hindered the analysis of regional variations. After a few years of hard work, a pilot project under the auspices of the INES Working Party has gathered a range of interesting regional data on some key education indicators. The most recent edition of Education Indicators in Focus (EDIF) explores subnational variations in educational attainment and labour market outcomes.
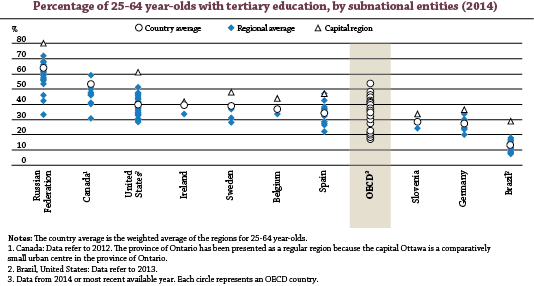
The chart above shows clearly the relevance of subnational variations. For one of the key measures of a country’s human capital, the tertiary attainment rate in the adult population, the subnational variation in some countries is almost as wide as between-country variations. This is true, obviously, for large countries, such as Canada, the Russian Federation and the United States, but also for Germany, Spain and Sweden. Smaller countries, such as Belgium, Ireland and Slovenia, show less variation, but differences are still significant.
In all countries, the capital region, which attracts a large share of the nation’s human capital for the government and the industries and services concentrated around it, has a larger population of tertiary-educated adults than most other regions. This observation in itself is relevant for education policy: the civil servants and advisors designing those policies often live in environments that bear no resemblance to other parts of the country.
A better understanding of the magnitude of subnational variations in education indicators prompts a range of policy-relevant questions. Huge disparities in human capital between regions call into question the validity of uniform nation-wide education and skills strategies. Regional variation calls for policies that are adapted to the regions’ specific contexts and realities. But nation-states might also have an interest in promoting educational inclusion in the country by taking the steps necessary to help regions at the bottom of the distribution move closer to the average. Significant regional variation might also signal the need for continuing involvement of the central state to ensure that regions have similar capacity and resources to support skills development.
From a statistical point of view, exploring subnational variations raises doubts about the meaningfulness of national averages in international statistics. It is necessary to understand what the country average is and the magnitude of the regional variation around it. After all, an average is just an average, a statistical construct, not a reality.
Chart source: OECD/NCES (2015), Education at a Glance Subnational Supplement, http://nces.ed.gov/surveys/AnnualReports/oecd/.